The "Mind Visualization" Tool Popular in European and American Classrooms: "Thinking Maps" - 8 Types of Mind Maps
1. 🎓 Introduction to Thinking Maps
Thinking Maps are a set of visual tools designed to help students organize and represent their thoughts, ideas, and information in a structured manner. Originating from the work of Dr. David Hyerle in the 1980s, these maps have gained widespread adoption in educational settings across Europe and America as a powerful "mind visualization" technique. Unlike traditional note-taking or rote memorization, Thinking Maps engage learners by tapping into visual-spatial intelligence, making complex concepts more accessible and fostering critical thinking skills. They serve as a common visual language in classrooms, enabling teachers to guide students through various cognitive processes such as defining, comparing, sequencing, and classifying. The popularity of Thinking Maps stems from their versatility and alignment with modern pedagogical approaches that emphasize metacognition and student-centered learning. By providing a framework for clear communication and deeper understanding, these tools have become integral to curricula in subjects ranging from language arts and science to social studies and mathematics, helping educators meet diverse learning needs and promote academic success.
1.1 📚 What Are Thinking Maps?
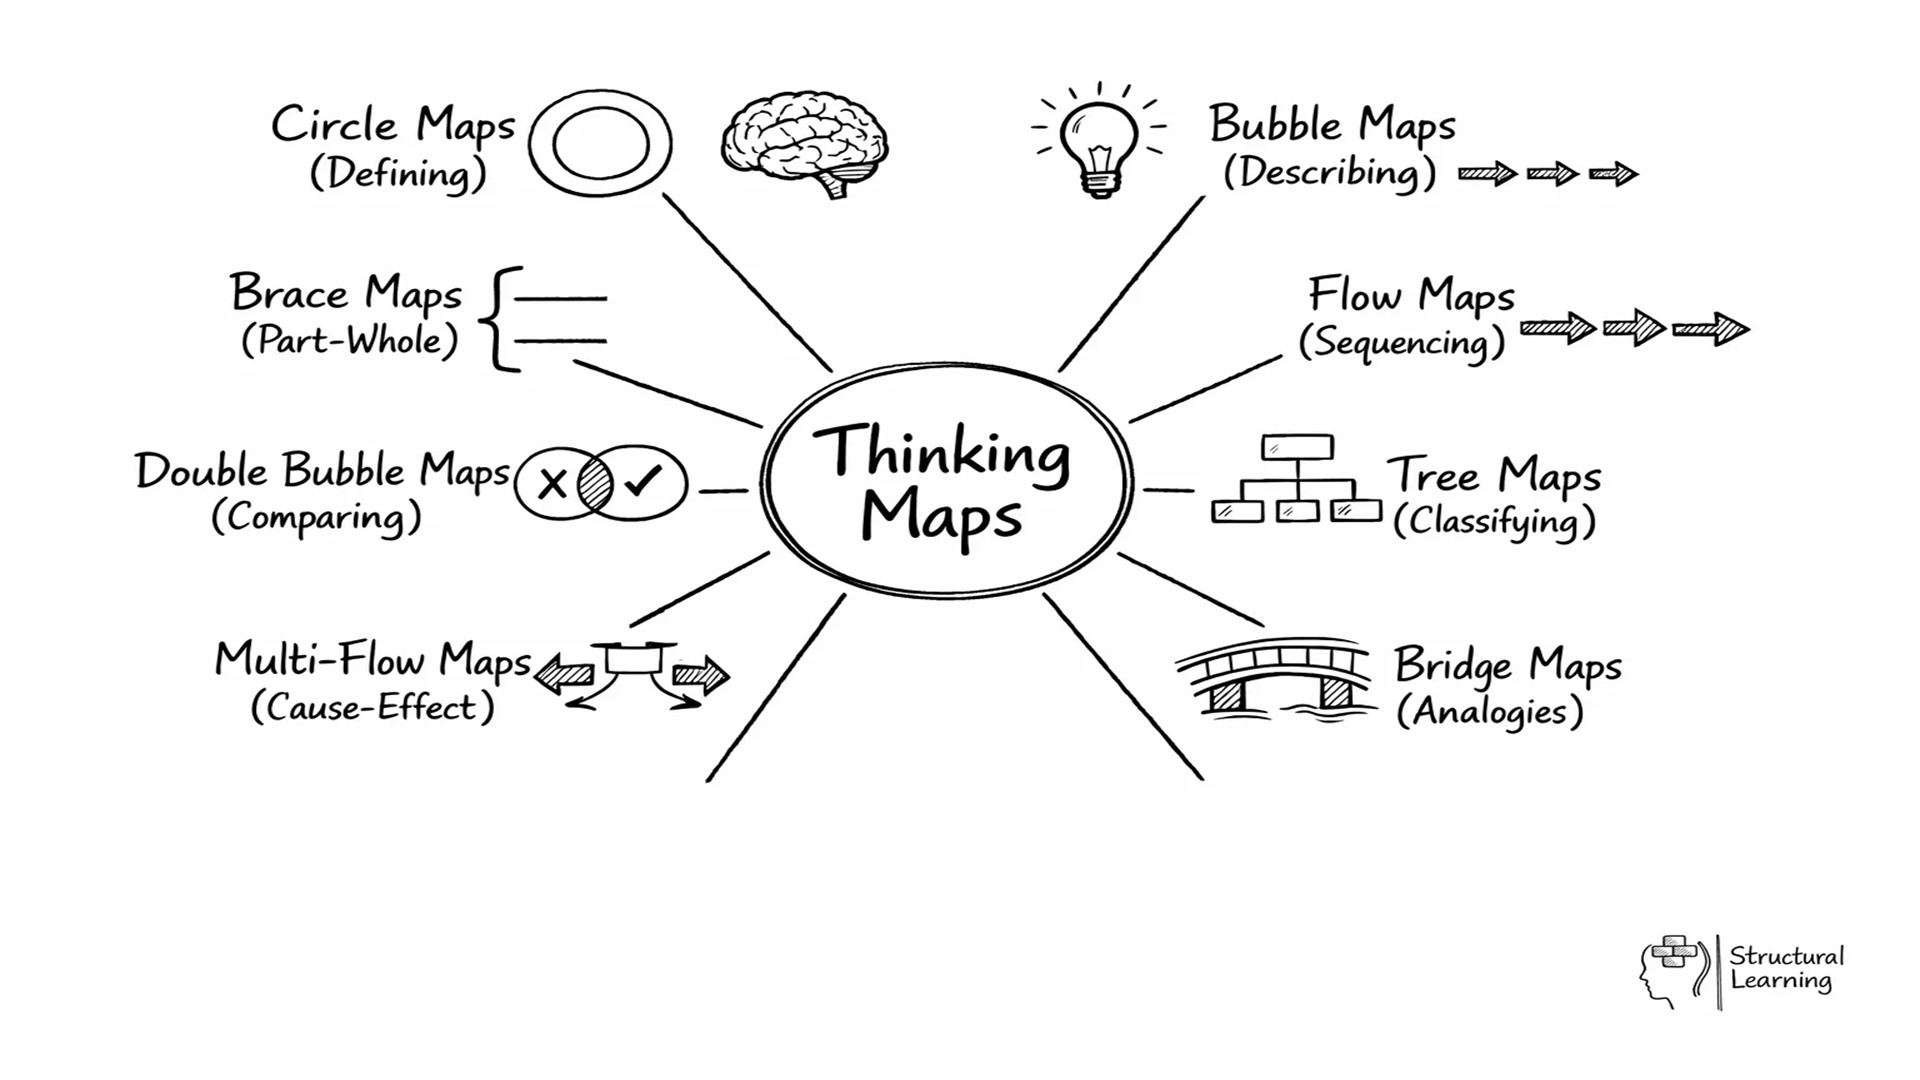
Thinking Maps are defined as a unified set of eight visual patterns, each corresponding to a specific cognitive skill. They are not merely graphic organizers but a comprehensive system based on fundamental thinking processes like brainstorming, describing, comparing, and cause-effect analysis. The maps use simple shapes, lines, and keywords to create diagrams that mirror how the brain naturally processes information. This visual approach reduces cognitive load, allowing students to focus on content rather than format. Research from educational psychology supports their effectiveness in enhancing memory retention, comprehension, and problem-solving abilities. In practice, Thinking Maps are often introduced early in education and used progressively through higher grades, adapting to more complex tasks. They encourage active learning by enabling students to externalize their mental models, facilitating collaboration and discussion in classroom settings.
1.2 🌍 Why Are They Popular in Classrooms?
The adoption of Thinking Maps in European and American classrooms is driven by their proven benefits in fostering 21st-century skills. Educators value these tools for promoting equity in learning, as they provide a scaffold that supports all students, including English language learners and those with learning differences. By making thinking visible, teachers can quickly assess understanding and provide targeted feedback. Studies, such as those from institutions like Harvard Graduate School of Education, highlight how visual tools improve engagement and reduce achievement gaps. In countries like the UK, USA, and Canada, Thinking Maps are incorporated into national standards and professional development programs, with schools reporting improved test scores and student confidence. Their popularity also stems from adaptability across disciplines; for instance, a Flow Map might be used in history to timeline events, while a Bubble Map aids in character analysis in literature. This flexibility, combined with ease of use, has made Thinking Maps a staple in modern educational toolkits.
2. 🗺️ The First Four Types: Maps for Defining and Describing
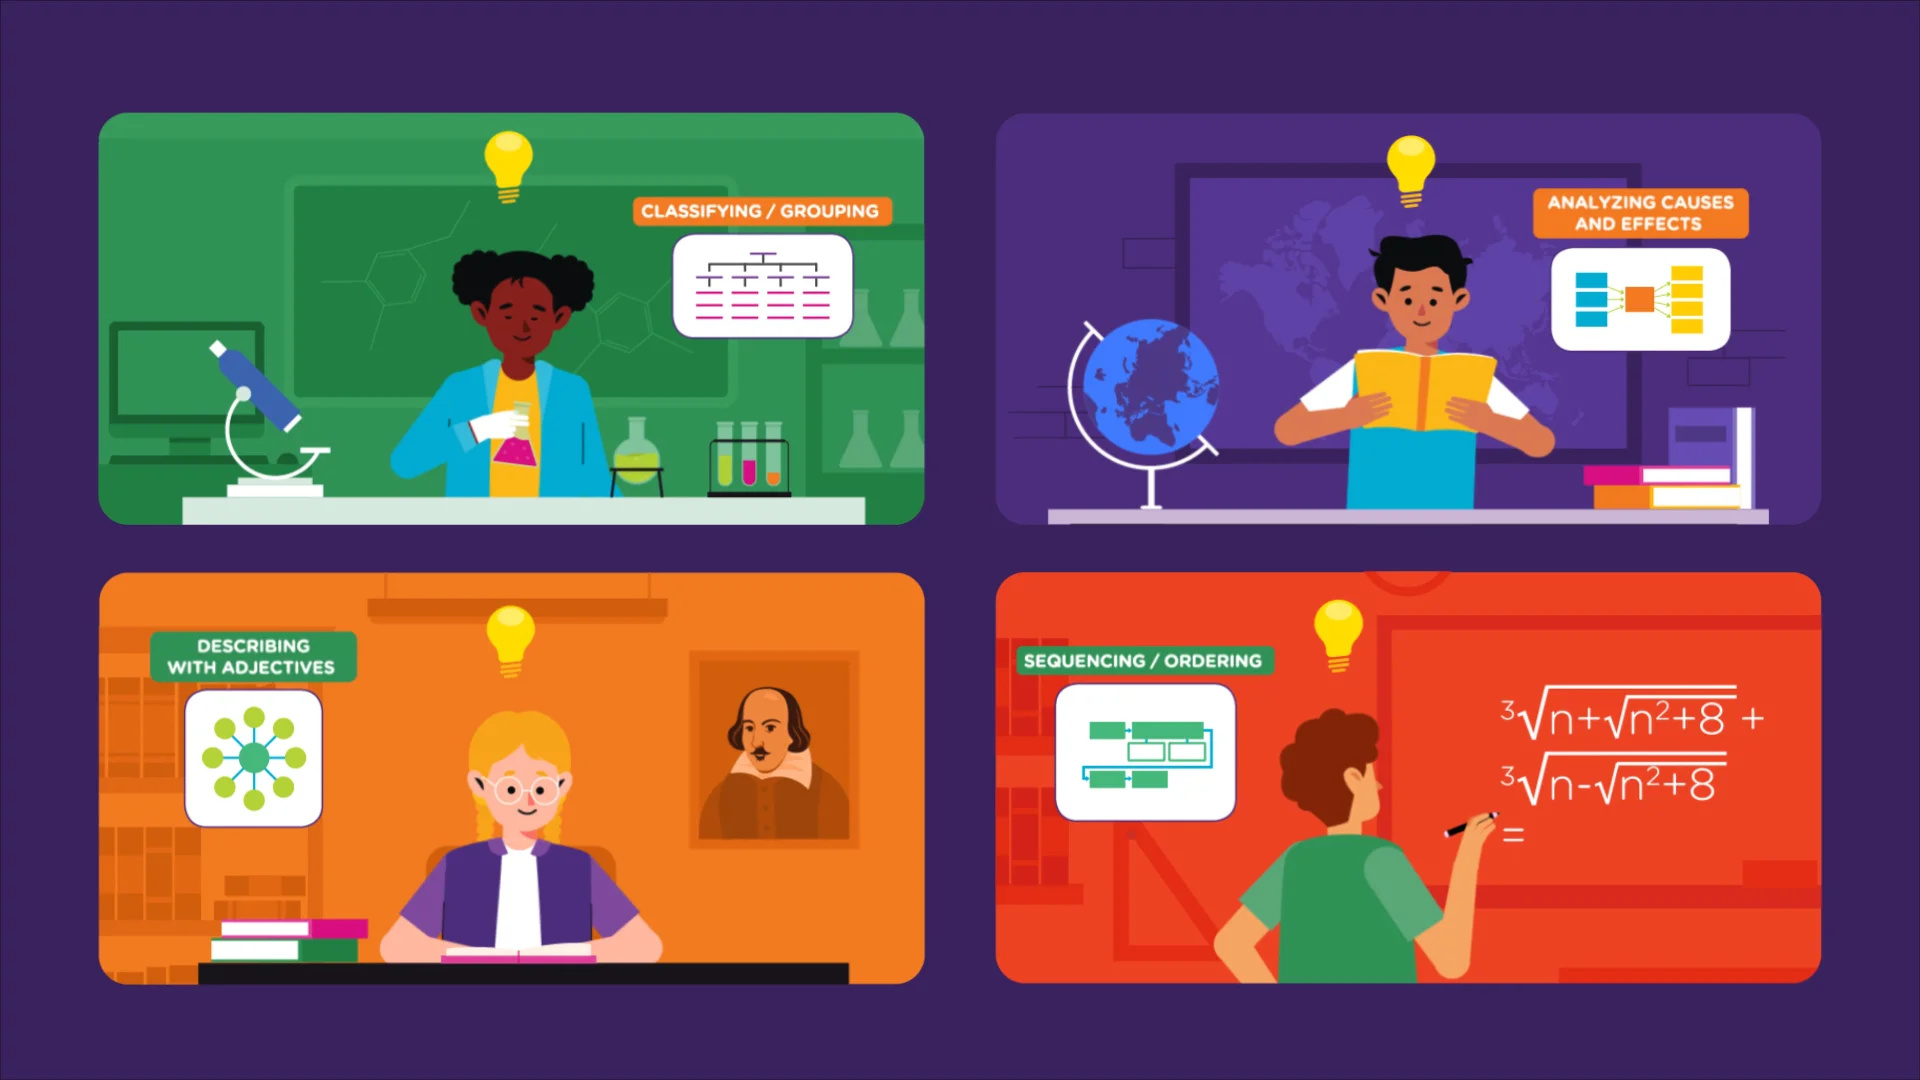
The eight types of Thinking Maps can be grouped based on their primary functions. The first four types—Circle Map, Bubble Map, Double Bubble Map, and Tree Map—are primarily used for defining concepts, describing attributes, comparing items, and classifying information. These maps help students build foundational knowledge by organizing static information in visual formats. They are often introduced in elementary grades to develop vocabulary, observation skills, and logical grouping. For example, in a science class, a Circle Map might brainstorm ideas about ecosystems, while a Tree Map could categorize animal species. By using these maps, learners move from concrete to abstract thinking, enhancing their ability to analyze and synthesize information. Teachers in classrooms frequently employ these types during introductory lessons or review sessions to solidify understanding and encourage participatory learning.
2.1 🔄 Type 1: Circle Map
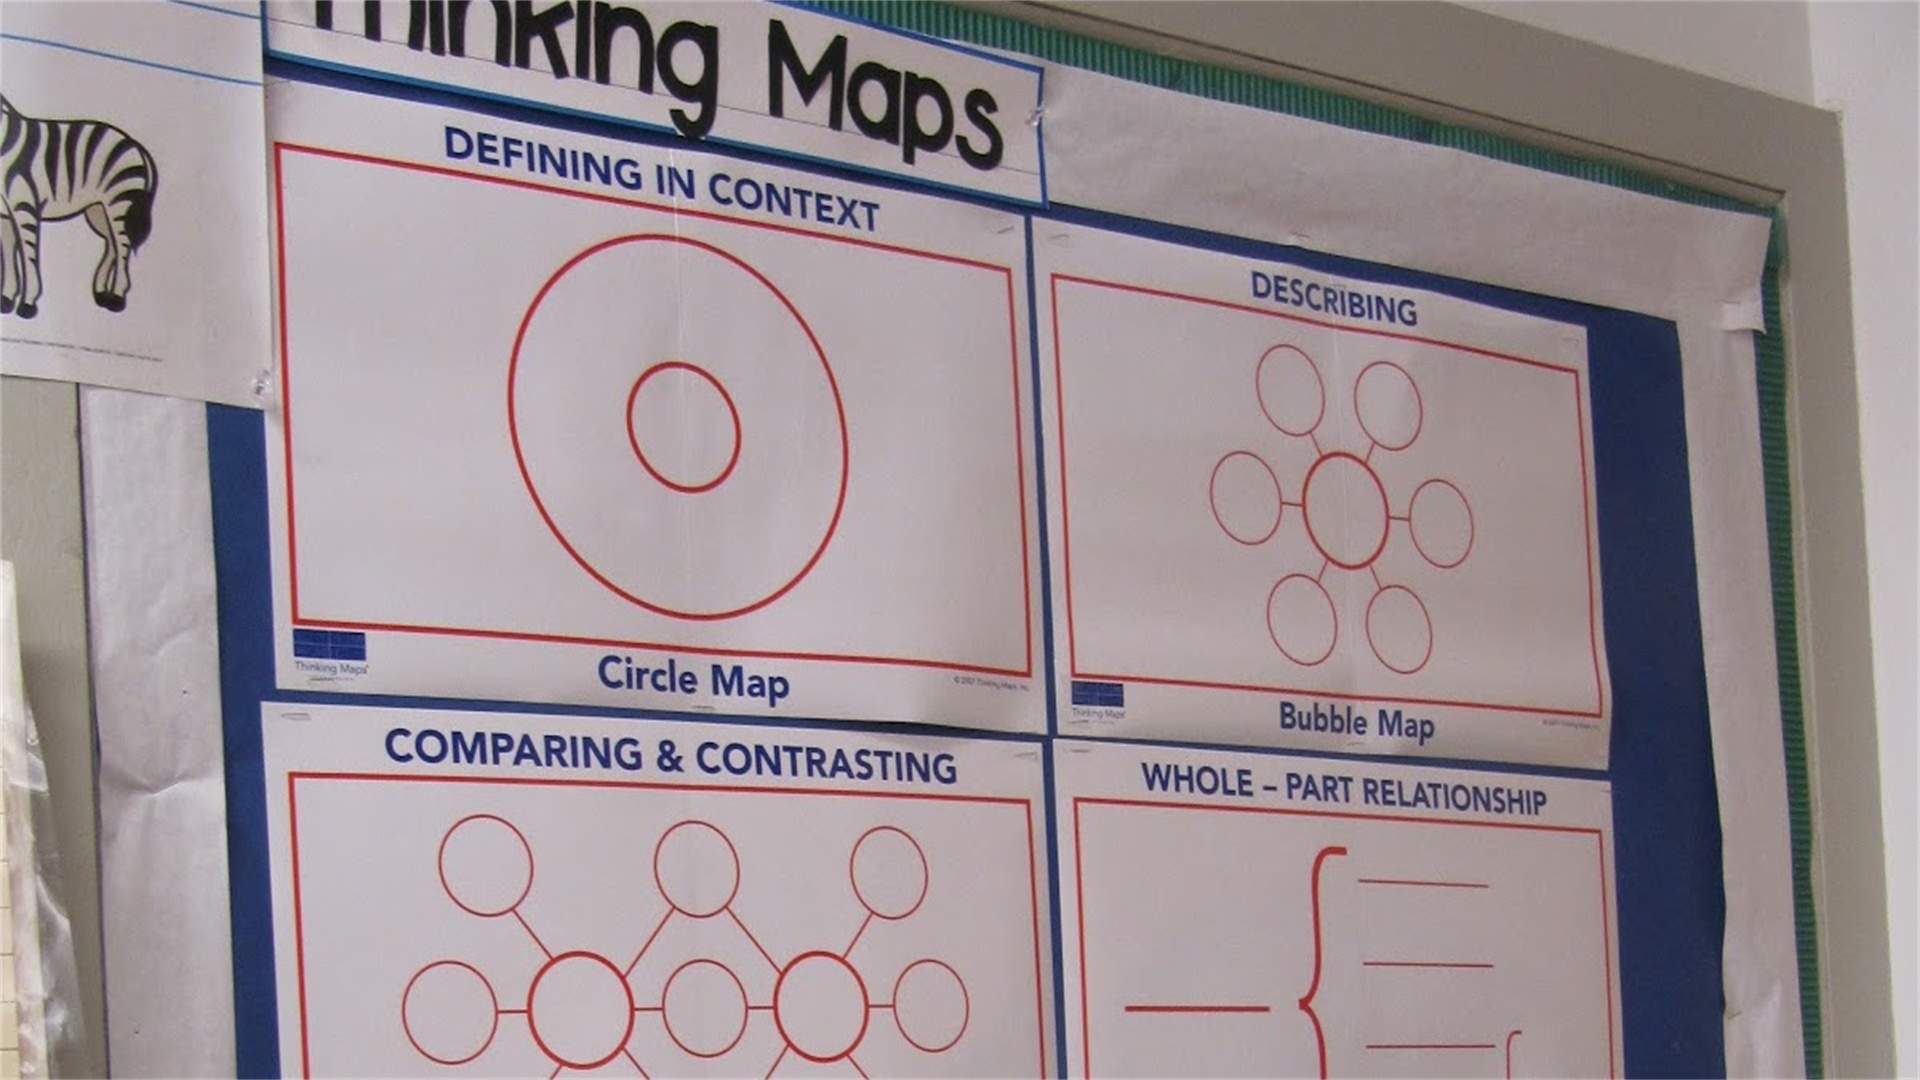
The Circle Map is used for brainstorming and defining concepts in context. It consists of two circles: a small inner circle where the central topic is written, and a larger outer circle containing related ideas, words, or images. This map helps students explore prior knowledge, generate ideas, or define a term by considering its associations. For instance, in a geography lesson on "climate change," students might fill the outer circle with terms like "greenhouse gases," "rising temperatures," and "renewable energy." The Circle Map is versatile and often serves as a starting point for inquiries or projects. In classrooms, it is commonly used in warm-up activities to activate schema, or in writing exercises to develop topic sentences. Emojis like 🔄 symbolize the cyclical nature of brainstorming, where ideas flow outward from the core.
2.2 💭 Type 2: Bubble Map
The Bubble Map focuses on describing qualities and characteristics using adjectives. It features a central bubble for the main subject, surrounded by outer bubbles connected with lines, each containing a descriptive attribute. This map enhances vocabulary and observational skills by encouraging detailed descriptions. For example, when studying a historical figure like "Marie Curie," students might use bubbles with words like "persistent," "innovative," or "radiant." In language arts, it aids in character analysis, while in science, it can describe properties of materials. The Bubble Map is particularly popular in primary education for building descriptive language, but it is also used in higher grades for critical analysis. Emojis like 💭 represent the thought bubbles that capture descriptive thinking, making it a favorite tool for fostering creativity and precision in expression.
2.3 🤝 Type 3: Double Bubble Map
The Double Bubble Map is designed for comparing and contrasting two items, ideas, or concepts. It resembles two overlapping Bubble Maps, with central bubbles for each subject. Similarities are placed in bubbles connected to both centers, while differences are in bubbles linked to only one subject. This map develops analytical skills by highlighting commonalities and distinctions. In a social studies class, students might compare "democracy and monarchy," noting similarities like "governance systems" and differences such as "leadership selection." The Double Bubble Map is widely used in classrooms for essay planning, debate preparation, or scientific comparisons. It promotes higher-order thinking by moving beyond mere description to evaluation. Emojis like 🤝 symbolize the connection and comparison between entities, aiding in visual differentiation and collaborative discussions.
2.4 🌳 Type 4: Tree Map
The Tree Map is used for classification and grouping information into categories and subcategories. It resembles an organizational chart, with a main topic at the top, branching into categories, and further into specific details. This map helps students break down complex topics into manageable parts, fostering logical thinking. For example, in a biology lesson on "animal kingdoms," categories might include "mammals," "birds," and "reptiles," with subcategories like "habitats" or "diets." The Tree Map is instrumental in structuring essays, summarizing chapters, or organizing research data. In educational settings, it aligns with curriculum standards that emphasize categorization and hierarchical understanding. Emojis like 🌳 reflect the branching structure, making it intuitive for learners to visualize relationships and systems.
3. 🗺️ The Next Four Types: Maps for Sequencing and Relating
The remaining four types—Flow Map, Multi-Flow Map, Brace Map, and Bridge Map—focus on dynamic processes, cause-effect relationships, part-whole analysis, and analogical thinking. These maps support more advanced cognitive skills such as sequencing, predicting, and synthesizing. They are often introduced in upper elementary or middle school grades as students tackle complex texts and problems. For instance, a Flow Map might outline the steps in a math problem-solving strategy, while a Multi-Flow Map could analyze the causes and effects of a historical event. In classrooms, these maps are integrated into project-based learning and STEM activities to develop systemic thinking. By visualizing sequences and relationships, students enhance their ability to reason, plan, and communicate complex ideas effectively.
3.1➡️Type 5: Flow Map
The Flow Map is used for sequencing and ordering events, steps, or processes. It consists of a series of connected boxes or stages, often with arrows indicating direction, allowing students to map out sequences chronologically or logically. This map is ideal for storytelling, scientific procedures, or historical timelines. For example, in a chemistry class, students might use a Flow Map to illustrate the steps of an experiment, from hypothesis to conclusion. In language arts, it can plot the narrative arc of a story. The Flow Map promotes skills like planning and procedural writing, which are emphasized in curricula for developing logical progression. Emojis like➡️highlight the directional flow, helping learners visualize order and consequence, and is commonly used in lesson plans to scaffold instruction.
3.2 🔀 Type 6: Multi-Flow Map
The Multi-Flow Map analyzes causes and effects, focusing on the relationships between events. It features a central event box, with causes listed on the left and effects on the right, connected by arrows. This map encourages critical thinking by exploring why things happen and their repercussions. In a social studies unit on "the Industrial Revolution," students might identify causes like "technological innovations" and effects such as "urbanization." The Multi-Flow Map is also applied in science for explaining phenomena or in literature for character motivations. It is a staple in classrooms for problem-solving and debate, fostering predictive and evaluative skills. Emojis like 🔀 symbolize the interconnected flow of causes and effects, making it a powerful tool for understanding complex systems and fostering reasoned arguments.
3.3 🦴 Type 7: Brace Map
The Brace Map is designed for part-whole relationships, breaking down a physical object or concept into its components. It uses braces (similar to brackets) to show how parts relate to a whole, starting with the main item on the left and branching to subparts. This map is excellent for structural analysis, such as decomposing a machine in engineering or the organs in a human body for biology. For instance, in a technology class, students might use a Brace Map to dissect a computer into CPU, monitor, and keyboard. It enhances spatial reasoning and detailed observation, skills valued in STEM education in schools. Emojis like 🦴 represent the skeletal structure, emphasizing the map's focus on physical or conceptual anatomy, and it is often used in hands-on projects or technical writing.
3.4 🌉 Type 8: Bridge Map
The Bridge Map is used for seeing analogies and relationships between pairs of items. It features a bridge-like structure with a relating factor at the top, connecting two sets of words or concepts that share a similar relationship. This map develops analogical thinking, which is crucial for problem-solving and creativity. For example, in a math lesson, students might bridge "fraction" to "decimal" with the relating factor "represents part of a whole." In literature, it could analogize characters across different stories. The Bridge Map is popular in classrooms for vocabulary building, standardized test preparation, and interdisciplinary connections. Emojis like 🌉 symbolize the bridging of ideas, helping learners transfer knowledge and recognize patterns, thereby deepening conceptual understanding.
4. 🏫 Practical Applications in European and American Classrooms
Thinking Maps are not just theoretical tools; they are actively implemented in diverse educational contexts across to enhance teaching and learning outcomes. Educators integrate these maps into daily lessons, assessments, and collaborative activities, adapting them to various subjects and grade levels. For instance, in the UK, Thinking Maps are used in literacy programs to improve reading comprehension, while in the US, they align with Common Core standards for critical thinking. Teachers often combine multiple map types in project-based learning, such as using a Circle Map for brainstorming, a Tree Map for organizing research, and a Flow Map for presenting findings. Technology has further expanded their use, with digital platforms allowing interactive map creation. This section explores how Thinking Maps are applied in real classroom settings and the tangible benefits they offer to students and teachers alike.
4.1 📝 How Teachers Use Thinking Maps
Teachers employ Thinking Maps as instructional scaffolds to differentiate instruction and meet diverse learner needs. In introduction phases, they might use Circle Maps for KWL (Know, Want to know, Learned) activities to assess prior knowledge. During lessons, Bubble or Double Bubble Maps facilitate group discussions, while Tree Maps help in note-taking and summarizing. For assessment, students create Flow or Multi-Flow Maps to demonstrate understanding of processes or cause-effect relationships. In classrooms, professional development workshops train educators to incorporate maps across curricula; for example, a science teacher might use Brace Maps for lab reports, and a history teacher might use Bridge Maps for comparative essays. Digital tools like Google Drawings or dedicated Thinking Maps software enable collaborative map-making, fostering peer learning. Case studies from schools in countries like Germany and Canada show that consistent use improves classroom management and student engagement, as maps provide clear structures for activities.
4.2 🧠 Benefits for Students
Students gain multifaceted benefits from using Thinking Maps, which contribute to academic and personal growth. Cognitively, the maps enhance memory retention by leveraging visual-spatial processing, making recall easier during exams. They also develop metacognitive skills, as students reflect on their thinking processes when creating maps. Socially, collaborative map-building promotes teamwork and communication, essential for lifelong learning. In terms of academic performance, research from educational agencies indicates that students using Thinking Maps show improved writing coherence, problem-solving accuracy, and test scores. For English language learners, the visual support aids vocabulary acquisition and comprehension. Additionally, the maps foster creativity and confidence, as students can express ideas without fear of textual errors. Examples include using Flow Maps for planning essays in AP courses or Bubble Maps for art critique, demonstrating versatility across learning styles and subjects.
5.✅Conclusion
In summary, Thinking Maps represent a transformative "mind visualization" tool that has revolutionized classrooms across Europe and America. By offering eight distinct visual patterns—Circle, Bubble, Double Bubble, Tree, Flow, Multi-Flow, Brace, and Bridge Maps—they cater to a wide range of cognitive processes, from basic description to complex analogical thinking. Their popularity stems from proven effectiveness in enhancing student engagement, critical thinking, and academic achievement, while supporting inclusive education. As educational paradigms shift towards visual and collaborative learning, Thinking Maps provide a robust framework that aligns with 21st-century skills. Educators are encouraged to further integrate these tools, leveraging technology for innovative applications. Ultimately, Thinking Maps empower learners to make their thinking visible, fostering a deeper understanding of content and preparing them for future challenges in an increasingly complex world.
You May Have Missed

5 Steps to Build an Efficient "Classroom Learning Loop"
The Classroom Learning Loop is a dynamic, iterative educational framework designed to optimize teaching and learning through continuous cycles of planning, instruction, assessment, and reflection. Rooted in pedagogical theories such as Kolb's experiential learning and the Plan-Do-Check-Act (PDCA) model, this approach transforms traditional linear teaching into a responsive system that adapts to student needs in real time.

5 Underlying Principles and 3 Practical Tools for Scientific Memory
For centuries, students, professionals, and lifelong learners have struggled with the same fundamental challenge: how to remember information effectively and efficiently. We've all experienced the frustration of studying for hours, only to draw a blank during an exam or a critical presentation.

The Core of the IB (International Baccalaureate) Curriculum is Not Just "Difficult"
The International Baccalaureate (IB) Diploma Programme, established in 1968, has grown into a globally recognized educational framework offered in over 5,000 schools across 150 countries. It is frequently described as one of the most demanding pre-university curricula, often compared to Advanced Placement (AP) or A-Levels. This reputation for rigor leads many to equate the IB with sheer academic difficulty, focusing on its challenging assessments and broad subject requirements. However, such a narrow view obscures the program's foundational philosophy. The core of the IB is not merely about being "hard"; it is about fostering holistic development, critical inquiry, and global citizenship. This article explores the essential components that define the IB experience, drawing insights from international educational discourse to reveal how it prepares students for university, career, and life beyond exams. By examining the IB Learner Profile, core elements, curriculum structure, and outcomes, we will demonstrate that the program's true value lies in its integrated approach to education, which transcends traditional metrics of difficulty.
We focus on sharing high-quality original content covering diverse fields such as technology & digital, life essays, and practical useful tips. We polish every article with care to bring you a warm and in-depth reading experience. Explore more interesting new knowledge only at FunLab666.